Here are flowcharts and an excel doc from some alternate reality games. These charts give a good but small snapshot of some of the approaches used by ARG designers.
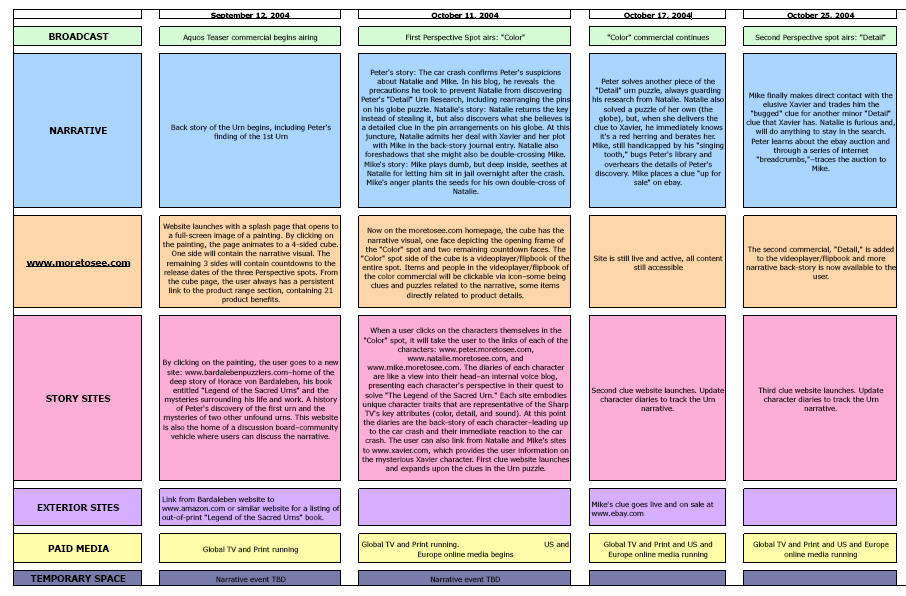
Legend of the Sacred Urns (aka More to See), Commissioned by Wieden Kennedy for the global launch of the Sharp Aquos LCD Flat Panel Television, designed by CampfireNYC, 2004 [See the casestudy]

Mike Monello of CampfireNYC generously supplied this chart to visualise the Sharp campaign. The ‘Story Sites’ section actually encompasses 4 central websites. The ‘Unified Theory Chart’ is, as Monello described to me, shorthand and is the first time they had used such a chart. [Full Chart PDF]
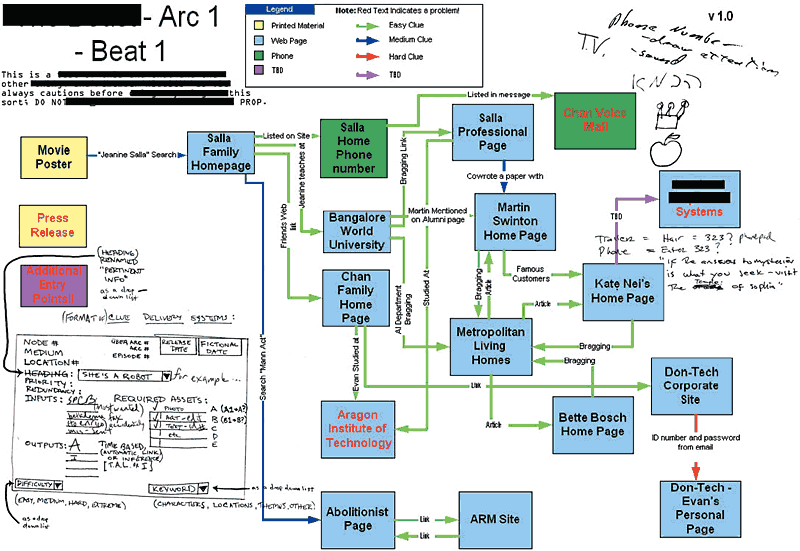
The Beast, Commissioned by Microsoft Game Studio, designed by many of the team at 42 Entertainment, 2001

source: avalonian42 (2001) ‘changame_flow’, Cloudmakers listserv, 25 Jul [Online] Available at: http://games.groups.yahoo.com/group/cloudmakers/files/ (Last accessed: 28 Nov, 2007)
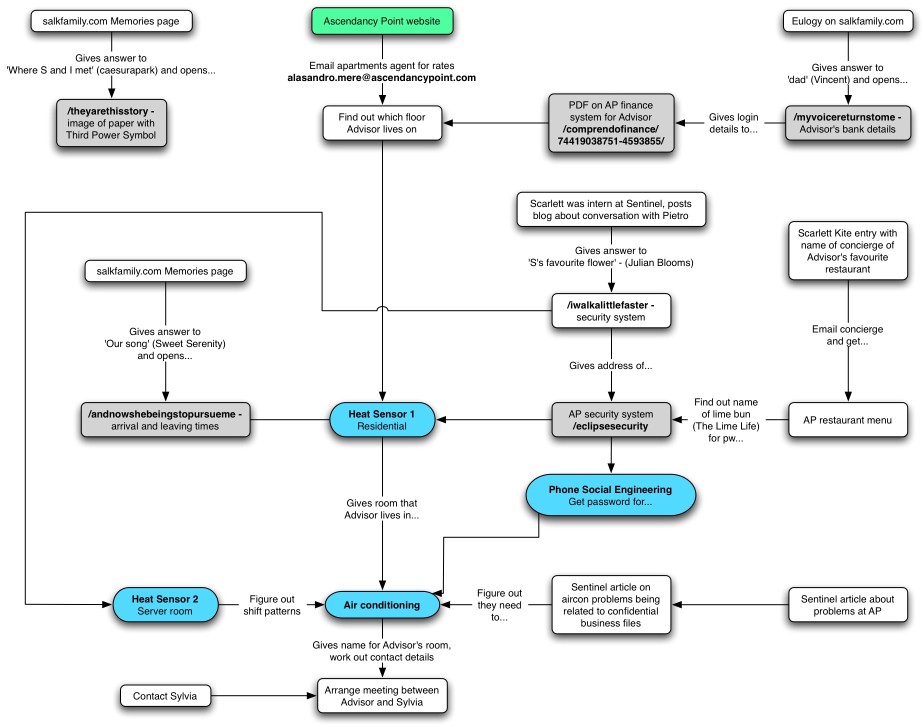
Perplex City, Mind Candy Design (note: many of the designers are now at Six to Start), 2005-2007

Ascendency Point Flowchart, there are other charts and story planning information at the source.
source: ‘Season One Story Planning’, SeasonOne.PerplexcityStories.com, [Online] Available at: http://seasonone.perplexcitystories.com/story.html (Last Accessed: 28 Nov, 2007)
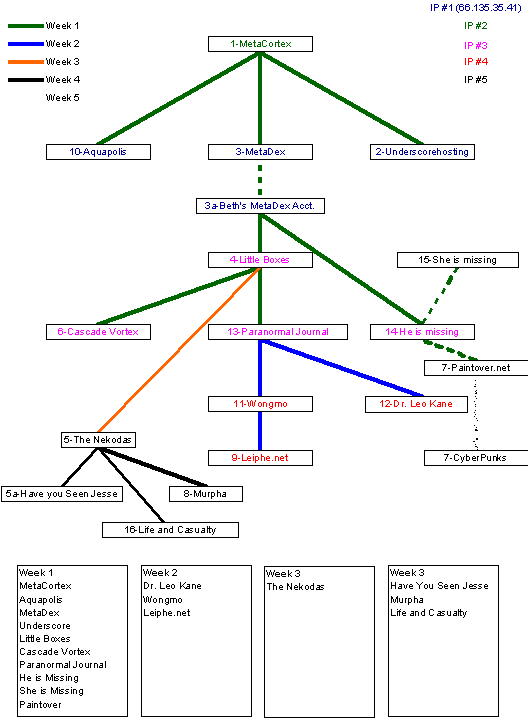
Metacortechs, independent (credits), 2003

source: ‘Behind the Scenes: Website Flow’, MUcredits [Online] Available at: http://www.metacortechs.com/mumowmow/ (Last Accessed: 28 Nov, 2007)
5 Replies